
How to Apply Menu Engineering to Maximize Profits for Cafes and Restaurants
A step-by-step guide to using POS data to classify menu items, redesign your menu, and steer customers toward your highest-margin offerings.
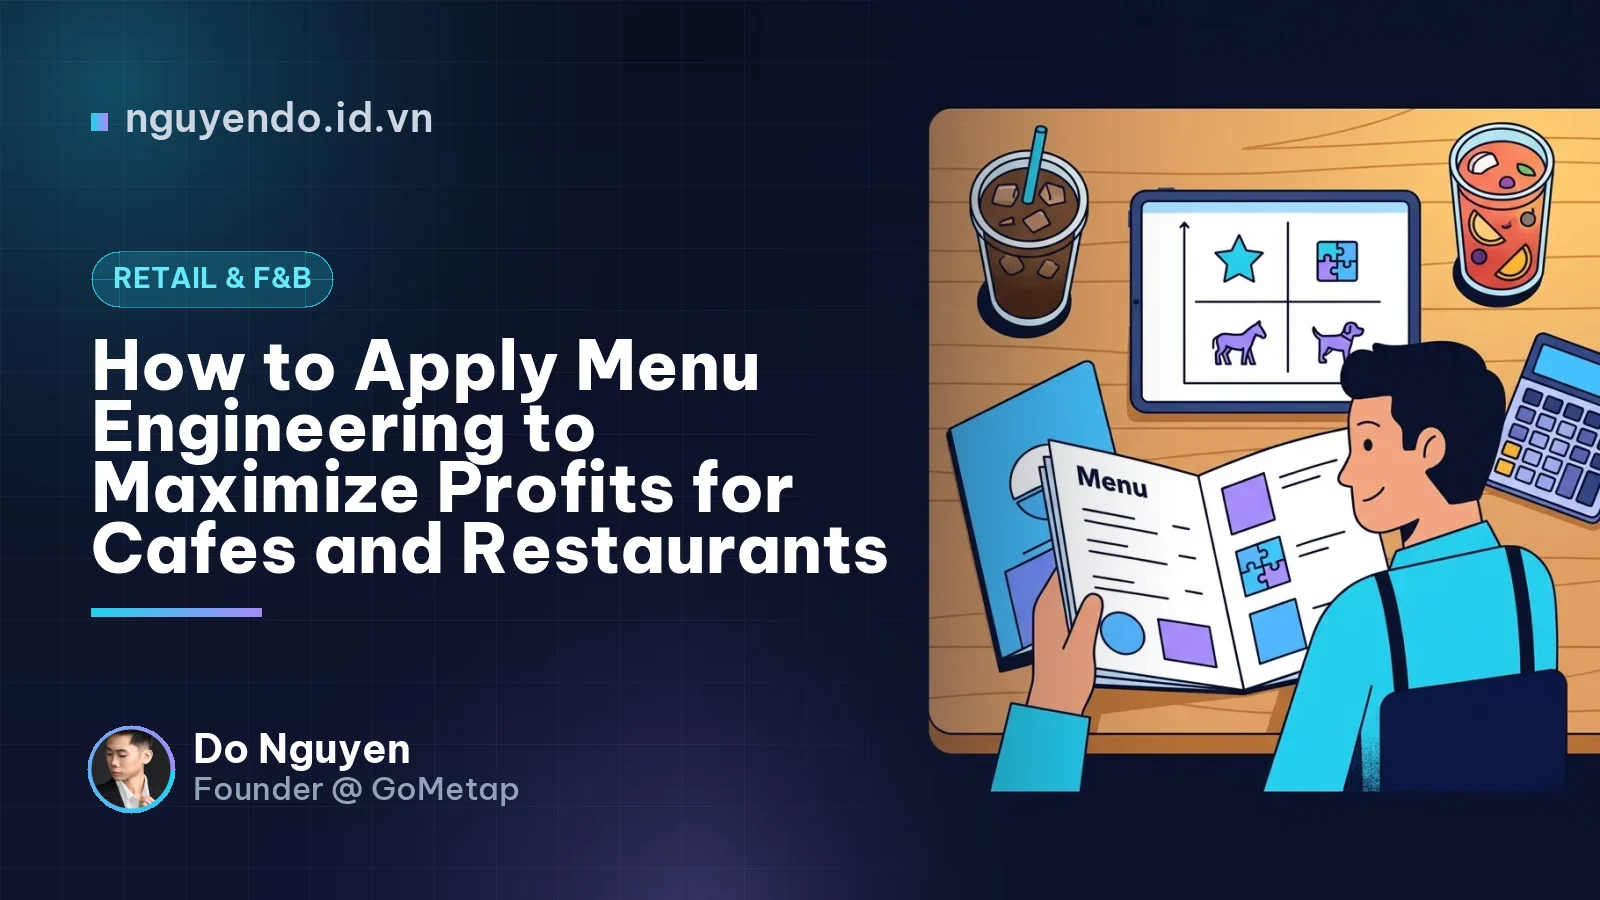
Table of contents
- What Is Menu Engineering and Why Does It Matter for Small Venues?
- The 4 Menu Engineering Categories
- A 4-Step Guide to Implementing Menu Engineering from POS Data
- Step 1: Collect Data Across the Last 30 to 60 Days
- Step 2: Calculate the 2 Core Metrics for Each Item
- Step 3: Establish Group Benchmarks
- Step 4: Practical Classification Example for a Small Cafe
- Post-Analysis Action Strategies by Category
- 1. Stars: Protect and Spotlight
- 2. Plowhorses: Strategically Optimize Margins
- 3. Puzzles: Drive Sales Volume
- 4. Dogs: Eliminate or Overhaul
- 4 Menu Redesign Tactics (Physical & Digital) to Steer Orders
- Action Checklist for Venue Owners This Week
Menu Engineering is an empirical method of analyzing sales data and unit contribution margins to position, price, and optimize menu layouts to maximize overall venue profits. Instead of designing menus purely on intuition or aggressively pushing bestsellers with razor-thin margins, applying Menu Engineering alongside your POS data allows owners to steer customers toward items that generate the most absolute cash per order.
Many cafe, milk tea, and small restaurant owners fall into the revenue trap: the dining room is packed, baristas work at peak capacity, yet net profit is negligible after covering monthly expenses. The culprit is often high sales volume in low-margin items, while high-profit items languish unnoticed in a corner of the menu.
This guide will walk you step-by-step through extracting POS figures, plotting a classification matrix, and restructuring your physical and digital menus to increase net profits starting next month.
What Is Menu Engineering and Why Does It Matter for Small Venues?
Menu Engineering evaluates the performance of every item on your menu using two core variables: Popularity (sales volume) and Unit Gross Profit (Contribution Margin - the net dollar amount pocketed per item sold).
The foundational mindset shift required for Menu Engineering is simple: Do not obsess over cost percentage; focus on absolute cash profit in your pocket.
Consider this hypothetical scenario at a small cafe:
- Iced Black Coffee: Retail price 25,000 VND, recipe cost 5,000 VND. The cost ratio is 20% (ideal on paper). Gross contribution margin per cup is 20,000 VND.
- Specialty Peach Orange Lemongrass Tea: Retail price 49,000 VND, recipe cost 17,000 VND. The cost ratio is ~35% (higher than black coffee). However, the gross contribution margin per cup is 32,000 VND.
If you solely assess cost percentage, black coffee appears superior. In reality, selling one cup of Peach Orange Lemongrass Tea yields an additional 12,000 VND in raw cash to pay for rent, staff payroll, and utilities. Menu Engineering provides full visibility into this balance across your entire menu.
The 4 Menu Engineering Categories
Plotting Sales Volume (High/Low) against Contribution Margin (High/Low) segments every food and drink item into one of four distinct quadrants:
| Item Quadrant | Popularity (Sales Volume) | Contribution Margin (Unit Profit) | Operational Role |
|---|---|---|---|
| 1. Stars | High | High | Flagship items: Highly desired by customers, delivering the most gross profit. |
| 2. Plowhorses | High | Low | Traffic drivers: High sales volume but thin margins; high kitchen/bar labor. |
| 3. Puzzles | Low | High | Hidden opportunities: High margin per sale, but ordered infrequently. |
| 4. Dogs | Low | Low | Underperformers: Low sales, low profit, and ties up prep work and perishable inventory. |
A 4-Step Guide to Implementing Menu Engineering from POS Data
You do not need complex analytical software. A simple Excel or Google Sheets file coupled with sales reports from your POS is sufficient.
Step 1: Collect Data Across the Last 30 to 60 Days
Access your POS system (such as item sales reports on GoMetap POS or an equivalent platform) and export sales metrics from the past 1 to 2 months. Note: Analyze categories separately (e.g., analyze Coffee, Fruit Teas, and Pastries in distinct batches) due to differing base cost structures.
Step 2: Calculate the 2 Core Metrics for Each Item
Build a spreadsheet with dedicated columns for an item group (e.g., an Espresso & Tea category with 5 items):
- Contribution Margin (CM) = Listed selling price (pre-tax) - Standard Recipe Cost.
- Sales Volume = Total unit sales within the selected timeframe.
Step 3: Establish Group Benchmarks
To determine what constitutes "High" or "Low," calculate category-wide averages:
- Average Contribution Margin = Total category gross profit / Total units sold.
- Popularity Benchmark: The standard F&B formula is
(100% / Total items in category) x 70%. For a category containing 5 items, the baseline average is 20%, which yields a 14% threshold when multiplied by 70%. Any item accounting for 14% or more of total category unit sales is classified as High Popularity.
Step 4: Practical Classification Example for a Small Cafe
Assume your venue logged 1,000 units sold over a month across a 5-item category:
| Item Name | Price | Recipe Cost | Profit/Cup (CM) | Sales Volume | Volume Share | Classification |
|---|---|---|---|---|---|---|
| Bac Xiu (Milk Coffee) | 35,000đ | 10,000đ | 25,000đ | 350 | 35% | Plowhorse (High volume, below-avg profit) |
| Oolong Cheese Tea | 49,000đ | 14,000đ | 35,000đ | 280 | 28% | Star (High volume, high profit) |
| Peach Orange Lemongrass Tea | 45,000đ | 13,000đ | 32,000đ | 220 | 22% | Star (High volume, high profit) |
| Fruit-Infused Cold Brew | 55,000đ | 15,000đ | 40,000đ | 90 | 9% | Puzzle (Low volume, very high profit) |
| Papaya Smoothie | 40,000đ | 18,000đ | 22,000đ | 60 | 6% | Dog (Low volume, low profit) |
(Assuming the average Contribution Margin for this group is ~29,750 VND/cup and the popularity benchmark is 14%).
The data exposes the structural issues: Bac Xiu generates the highest sales volume (350 cups), but yields only 25,000 VND in margin per cup. Meanwhile, Fruit-Infused Cold Brew brings 40,000 VND per cup with stable, batchable ingredients, yet sells only 90 units. The Papaya Smoothie yields minimal profit (22,000 VND), sells slowly (60 units), and introduces fresh ingredient spoilage risks.
Post-Analysis Action Strategies by Category
Once items are assigned to their respective quadrants, apply targeted strategies to optimize margins:
1. Stars: Protect and Spotlight
- Maintain strict quality control: Never cut recipe specs or ingredient portions for these items.
- Prime menu real estate: Place them in the upper right quadrant or center of paper menus, framed with "Best Seller" or "Must Try" tags.
- On E-menus and QR Order: Pin them to the top of the interface with high-resolution imagery.
2. Plowhorses: Strategically Optimize Margins
Customers are highly price-sensitive to these offerings (such as traditional iced milk coffee or standard milk tea). Rather than raising base prices directly:
- Upsell Toppings or Size Upgrades: Train cashiers or configure automated prompts on POS and ordering screens: "Would you like to add brown sugar boba or cheese foam for 10,000 VND?". Toppings carry exceptionally high contribution margins, transforming Plowhorse orders into Star-level net profits.
- Bundle Combos: Pair Bac Xiu with a pastry (a Puzzle item) to boost Average Order Value (AOV).
- Relegate to Standard Layout Spots: Regular customers order these items intentionally; do not waste prime menu real estate on them.
3. Puzzles: Drive Sales Volume
These items yield high margins; your objective is to drive customer trial:
- Rewrite Descriptions and Titles: Instead of "Fruit Cold Brew," rebrand it to "18-Hour Slow-Steeped Tropical Cold Brew."
- Deploy Psychology and Loyalty Incentives: Leverage loyalty platforms (e.g., push notifications via Apple Wallet/Google Wallet passes in GoMetap) to offer a 5,000 VND discount voucher or 2x reward points during off-peak windows. Even with a 5,000 VND discount, you still pocket 35,000 VND—far outperforming a standard coffee order.
- Staff Sampling and Micro-Incentives: Provide staff tastings and minor sales commissions. Service teams enthusiastically recommend items they have personally enjoyed.
4. Dogs: Eliminate or Overhaul
- Remove from the Menu: The optimal path for 80% of Dog items is immediate removal. This streamlines morning mise-en-place, eliminates fresh ingredient waste, and reduces visual clutter on the menu.
- The Single Exception: Retain a Dog item only if it relies on 100% shared ingredients with your Stars and caters to a mandatory companion demographic (e.g., a simple iced chocolate or warm milk for children accompanying coffee-drinking parents).
4 Menu Redesign Tactics (Physical & Digital) to Steer Orders
Once your revised catalog is finalized, leverage behavioral psychology across your layouts:
- Decoy Pricing: Place a premium item (e.g., 65,000 VND) directly next to your Star item (49,000 VND). The Star will immediately be perceived as a balanced, high-value choice.
- Eliminate Currency Symbols: Replace
49,000 VNDwith simplified notation like49or49k. This softens the subconscious friction associated with spending. - Constrain Choice Architecture: Keep categories between 5 and 7 items max. Excessive options induce decision fatigue (Paradox of Choice), causing patrons to default to familiar, cheap baseline items (Plowhorses).
- Sync Instantly Across POS and QR Order: Modern O2O solutions like GoMetap enable you to reorder menu items, apply "Best Seller" badges, and enforce Mandatory Modifiers (such as sugar/ice adjustments with targeted topping upsells) within minutes—without reprinting physical collateral.
Action Checklist for Venue Owners This Week
Convert these principles into bottom-line results using this 6-step checklist:
- Export POS Data: Pull item-level sales volume for the last 30 days.
- Audit Recipe Costs: Verify ingredient costs for your top 20 sellers to account for recent wholesale supplier price changes.
- Plot the 4 Quadrants: Identify at least 3 Stars, 3 Plowhorses, 3 Puzzles, and 3 Dogs.
- Cut 2-3 Dog Items: Free up refrigeration space and reduce station prep friction.
- Configure POS Upsell Modifiers: Link high-margin add-ons and toppings directly to Plowhorse items on cashier screens.
- Reorganize Menu Hierarchies: Relocate Stars and Puzzles to the top of your digital menus and primary counter signage, and align front-of-house staff to actively suggest these items over the next two weeks.
Comments
No comments yet. Be the first to share your thoughts!